
Using Fagan’s Nomogram to Assess Pre-Test Probability and Post-Test Probability
Before reading this post, I recommend you read about pre-test probability and our first post on likelihood ratios.
Case: You’re seeing a 45-year-old male requesting prostate cancer screening. What are your initial thoughts? Will you perform a digital rectal exam? Will you order PSA bloodwork?
He is Caucasian, does not have a family history of prostate cancer, and has no concerning lower urinary tract symptoms, unintentional weight loss, night sweats, or general malaise. Your pre-test probability for prostate cancer is low based on the history alone. You question whether you should offer further testing (you keep in mind your local cancer guidelines for prostate cancer screening).
You ask yourself the following questions:
What is my pre-test probability for prostate cancer? Let’s say 10%. For the purpose of illustrating how to use Fagan’s nomogram, let’s go further.
What is the positive LR for digital rectal exam (DRE) in detecting prostate cancer? It has been reported as 1.63 (1).
What is the negative LR? It has been reported as 0.93 (1).
What is Fagan’s Nomogram? It is a graphical tool used for calculating post-test probability, knowing the pre-test probability and likelihood ratio of a specific test (2).
Back to the base: Based on the + LR of 1.63, what is your post-test probability of ruling IN prostate cancer with DRE? Remember your pre-test probability is 10%. Let’s demonstrate using Fagan’s Nomogram:

Answer: Approximately 16% (not much of a difference from your pre-test probability).
You start with your pre-test probability data point (10%), plot your LR data point in the middle (1.63), then use a ruler to draw a straight line to get your post-test probability (16%).
Question: based on the -LR of 0.93, what is your post-test probability of ruling OUT prostate cancer using DRE?

Answer: <10% (even lower than your pre-test probability).
You start with your pre-test probability data point (10%), plot your LR data point in the middle (0.93), then use a ruler to draw a straight line to get your post-test probability (around 6 or 7%).
Case summary: Based on the likelihood ratios derived from the study, the digital rectal exam is poor at predicting the presence of prostate cancer (ruling it in) or the absence of prostate cancer (ruling it out).
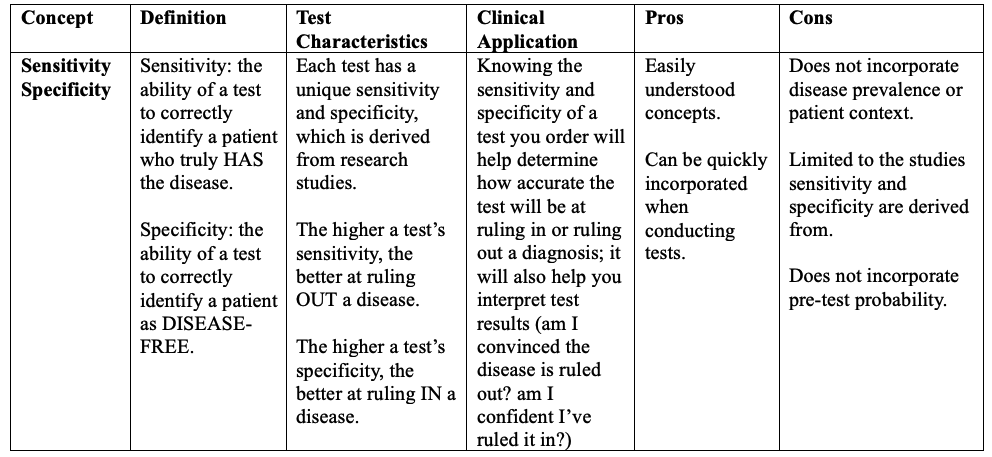
Let’s alter the case: Your 45-year-old male patient says his father had prostate cancer at age 50, and he reports new onset of lower urinary tract symptoms (double voiding, feeling of incomplete emptying, hesitancy). Your pre-test probability for prostate cancer is higher in this case scenario, maybe 50% (consider alternative diagnoses such as benign prostatic enlargement). You consider performing a DRE. Let’s see how this scenario plays out using Fagan’s nomogram. Recall the +LR for DRE is 1.63, and the -LR is 0.93.
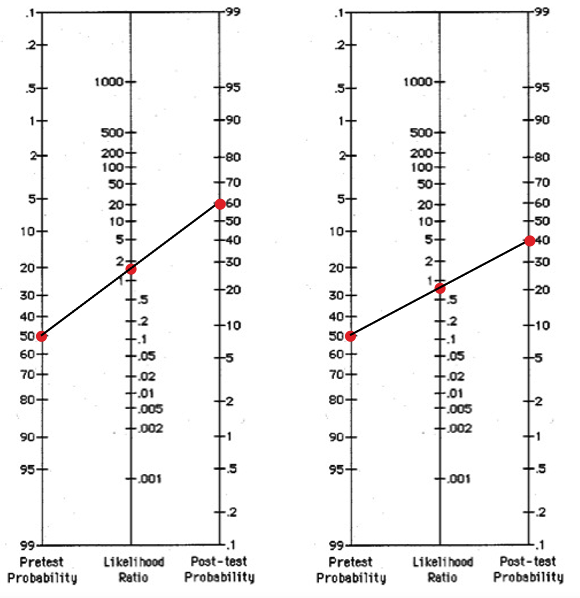
If you have positive DRE findings, your post-test probability is ~60% - so performing a DRE has more utility in this patient scenario compared to the first scenario. It will help rule in the possibility of prostate cancer, but clearly not the only test you will consider (i.e. your post-test probability is not 100%).
If you have negative DRE findings, your post-test probability is ~40%, high enough that you would want to pursue more testing to rule out the possibility of prostate cancer.
Key Take Home Point: it’s not expected that we use Fagan’s Nomogram for every test that we order (who has the time?) It is a tool to illustrate how LRs can change our post-test probability and helps us understand the general concept of likelihood ratios when conducting tests.
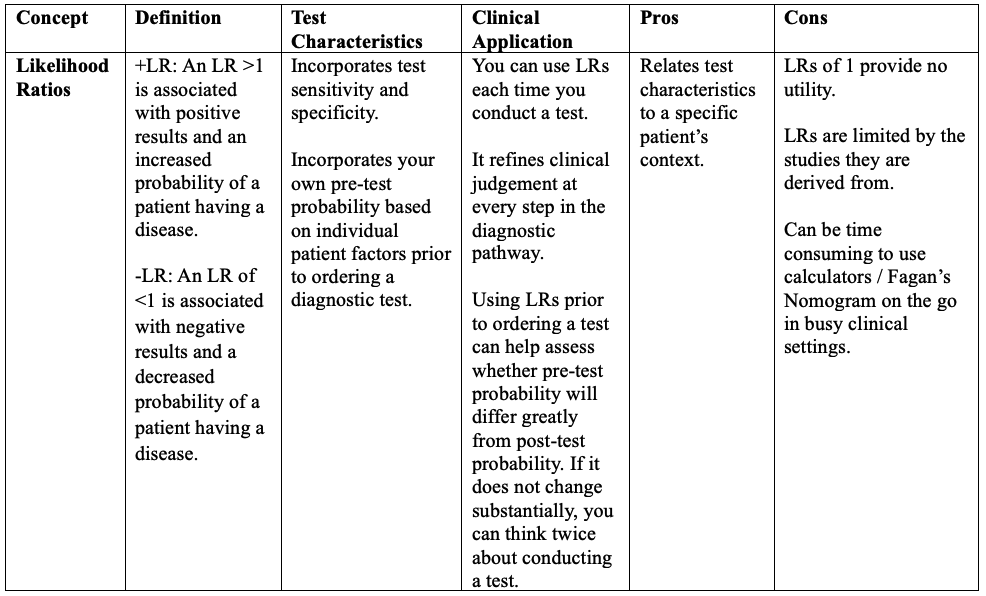
Summary Table of Diagnostic Accuracy Concepts

References/readings
Soronen V, Talala K, Raitanen J, Taari K, Tammela T, Auvinen A. Digital rectal examination in prostate cancer screening at PSA level 3.0-3.9 ng/ml: long-term results from a randomized trial. Scandinavian journal of urology. 2021;55(5):348-53. (VIEW HERE)
Safari S, Baratloo A, Elfil M, Negida A. Evidence Based Emergency Medicine; Part 4: Pre-test and Post-test Probabilities and Fagan's nomogram. Emergency (Tehran, Iran). 2016;4(1):48-51. (VIEW HERE)
Another resource: https://elentra.healthsci.queensu.ca/assets/modules/LR-module/significant_likelihood_ratio_values.html